World Cup By The Numbers
At one point during the World Cup, Jurgen Klinsmann (head coach of the US Men’s National Soccer Team) caught some flak for complaining before their group stage match against Germany. Klinsmann claimed the U.S. Team had to crisscross all corners of Brazil, while tournament favorites had less strenuous travel schedules.
“We have one day less to recover. They played yesterday, we played today. We played in the Amazon, they played in the locations where they don’t have to travel as much. Everything was done for the big favorites to move on. We have to do it the tough way but we’re going to do it the tough way.”
The travel required of teams like the US (tournament longshots) vs. futbol giants, and eventual winners of The 2014 World Cup, Germany, were brutal and unevenly distributed. Germany eventually came to win the World Cup, and the figures below help explain why. See our first graph below for the charted distance each team was required to do in the Group Stage of the 2014 World Cup.
In contrast, the U.S. had the worst travel schedule, a whopping 8,901 miles during the group stage alone, and it was highly publicized by the U.S. media. While Germany traveled the third least among 32 teams, requiring only 2,274 miles. Argentina, another finalist, only traveled 2,230 miles. Belgium (who was the most rested team during the World Cup Group Stage) had the least, only 1,108 miles of group stage travel. Almost a tenth less than the USA!
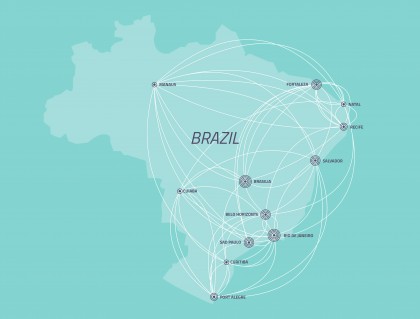
Klinsmann also noted the U.S. and others found themselves playing in difficult climates, as those found in Manaus, located in the middle of the sweltering hot and humid Amazon basin.
Now that the tournament is over, we thought we’d ask our graphic designer (extraordinaire) Matt Uminski, to take a look at the results. He produced some info-graphics that yielded some interesting and (not-so) surprising results.
Take a look at Matt’s maps and charts and see what you find and think. (CLUE- check out who the finalists were and see how far they traveled compared the 16 lowest seeds)

As you can clearly see, of the 32 teams who played during the group stage in the World Cup, travel clearly does have an existing correlation to advancement of teams during the games. Germany and Argentina and Belgium all advanced after having a less strenuous travel schedules than the upper quadrants of teams who were forced to travel further and longer for matches.
Out of 32 total teams, the sixteen teams who advanced out of the group stage were:
Belgium
Argentina
USA
Germany
Nigeria
Algeria
France
Switzerland
Costa Rica
Uruguay
Greece
Colombia
Chile
Netherlands
Mexico
Brazil

– Of the above chart, 32 teams had a total travel amount of 142,630 miles! That’s across the United States 47.5 times! Or round trip over 26 times!
– Group A (Brazil, Mexico, Cameroon and Croatia) had the most travel of any Group going 26,036 miles total. Group H (Belgium, Russia, Algeria and South Korea) had the least amount of travel required in the Group Stage, totaling all travel at 8,278 miles.
– The USA had a total of 8,901 miles for three games in the Group Stage. More than Group H in its entirety of games.

– 32 teams played with an average combined temperature of 82.9 degrees Fahrenheit throughout the Group Stage.
– Group B (Spain, Netherlands, Chile and Australia) played with the lowest average temperature at 78 degrees Fahrenheit.
-Group E (Switzerland, Ecuador, France and Honduras) played with the highest average temperature at 87 degrees Fahrenheit.
– The USA played their matches with an average temperature of 87.2 degrees Fahrenheit.

– World Cup Group Stage Travel assembled by group.
Group A (Mexico, Brazil, Cameroon, Croatia)
Group B (Netherlands, Spain, Chile, Australia)
Group C (Colombia, Ivory Coast, Japan, Greece)
Group D (Costa Rica, Uruguay, Italy, England)
Group E (France, Switzerland, Ecuador, Honduras)
Group F (Argentina, Nigeria, Bosnia Herzegovina, Iran)
Group G (Germany, USA, Portugal, Ghana)
Group E (Belgium, Algeria, Russia, South Korea)

World Cup Team Distance Traveled in Miles Group Stage
USA – 8,901 miles
ITALY – 8,777 miles
MEXICO – 8,724 miles
JAPAN – 7,753 miles
IVORY COAST – 6,984 miles
CAMEROON – 6,852 miles
COSTA RICA – 6,506 miles
PORTUGAL – 6,110 miles
CROATIA – 6,089 miles
SWITZERLAND – 5,501 miles
AUSTRALIA – 5,465 miles
URUGUAY – 5,313 miles
HONDURAS – 4,995 miles
BRAZIL – 4,570 miles
ENGLAND – 4,467 miles
BOSNIA HERZEGOVINA – 4,302 miles
ECUADOR – 4,138 miles
FRANCE – 3,639 miles
HOLLAND – 3,415 miles
COLOMBIA – 3,324 miles
GHANA – 3,319 miles
GREECE – 3,293 miles
SOUTH KOREA – 3,201 miles
SPAIN – 3,155 miles
NIGERIA – 3,130 miles
CHILE – 2,925 miles
IRAN – 2,853 miles
RUSSIA – 2,674 miles
ALGERIA – 2,480 miles
GERMANY – * 2,274 miles
ARGENTINA -** 2,230 miles
BELGIUM – 1,108 miles
Total mileage traveled by all 32 teams during the Group Stage = 142,630 miles. Or approximately BOS to LAX round trip 23.76 times.
Text By: Paul Lukez/Cameron King
Edited By: Cameron King
*All images are created by © Matthew Uminski and Andrew Luy for this particular blog post*